![]() Device Hardware
Device Hardware
"Hi-res picture" vs video
For the last ten years, air quality measurement required very expensive sensors that cost thousands of dollars. With the emergence of low cost sensors, things have changed: Instead of measuring once what we call a "hi-res picture" with a very precise lab instrument, we chose to use a "video stream" approach with affordable sensors left in place and continuously monitoring . Sensors really are just the first step, as embedded software and connectivity allow constant monitoring and much more.
Our products are designed in Korea with sensors from Europe, Japan and US and assembled in Vietnam. Our team closely manages each step of the manufacturing process in the factory, including the calibration process.
![]() Internet Connectivity
Internet Connectivity
What does connectivity add to our devices? This is often one of the first questions asked in the IoT world. The answer is continuous improvement through Over The Air updates.
After purchasing a device, you don’t normally expect it to get better over time. Software, though, receives updates. Since our devices have embedded software and are connected to the Internet, our hardware benefits over time the way software does.
Our whole line of connected products constantly evolves thanks to ongoing R&D and remote updates via WiFi.
![]() Device Software
Device Software
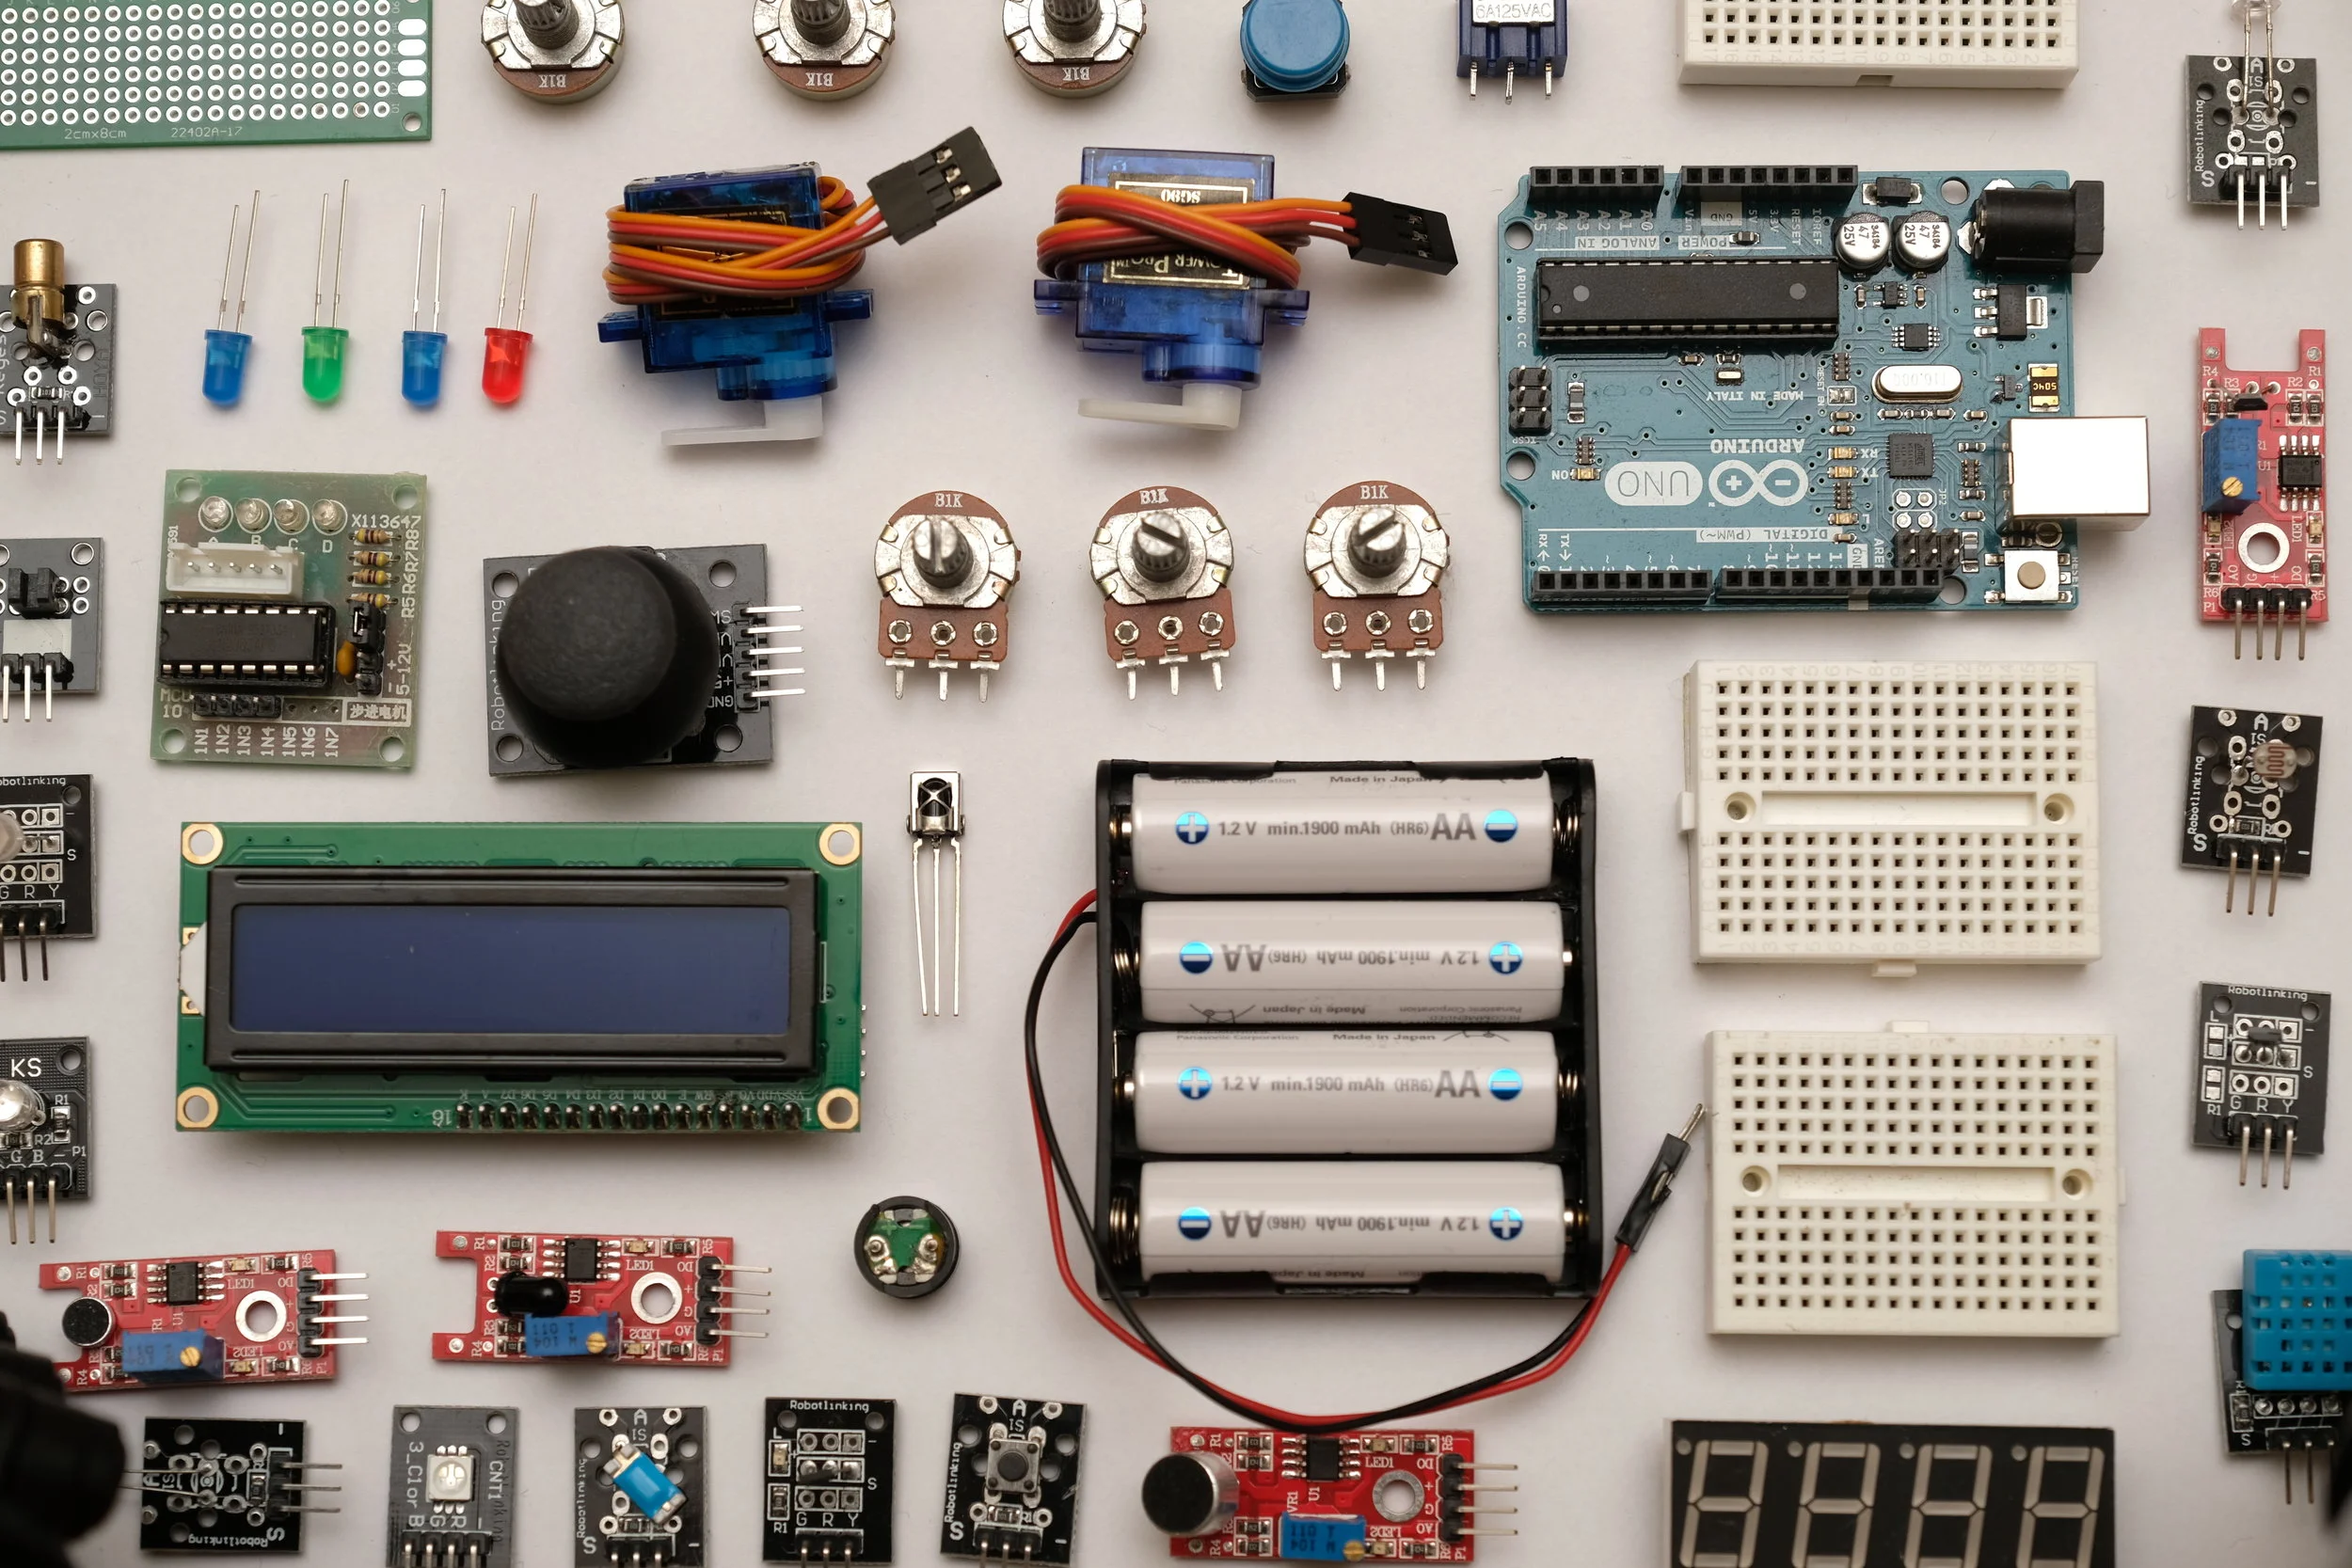
Our device software, aka embedded software, is a key component between the hardware sensors and the Cloud. The embedded software manages:
- Recalibration instructions sent via Wi-Fi. Recalibration is fully automatic on our devices and does not require any human intervention.
- Software update installation
- Sensor data processing
- Real-time behavior. Though data is sent to our Cloud in 5-minute intervals, some of our monitors need to provide real-time measurements. The device software manages the real-time features as needed for each type of device.
![]() Cloud Platform
Cloud Platform
Storing data in our Cloud includes many benefits:
- Retrieve the data remotely. Before, retrieving data implied having a technician plug via USB to each device to download the data.
- It’s secure. If your sensor goes out of service for any reason, there's no problem; data is securely stored and encrypted from the first day it’s turned on
- Be updated when needed. If a measurement needs your attention, you know it instantly via notifications sent under your custom parameters.
- Do in-depth analysis. To perform an analysis on big datasets, we take advantage of the unlimited CPU power of the Cloud. Consequently, we need very little CPU power in the devices themselves which keeps them cost-effective.
- Integrate with your existing tools. Since the data is stored on the Cloud, you can retrieve it from anywhere, from any device. Our API is developer-friendly so you can display your data the way you want. The server infrastructure is deployed in the US, in Europe and Japan.
![]() Cloud Apps
Cloud Apps
Cloud-to-Cloud apps allow you to create interactions with any other Cloud-connected service or product. Here are a few examples of what a Cloud app can help you achieve:
- Trigger a purification or filtration device based on pollution levels
- Boost the ventilation rate according to a given pollutant concentration
- Trigger a built-in air treatment system through connected thermostats
- Call an HVAC maintenance professional whenever pollution is too high for a certain amount of time
Some of our users (both individuals and companies) also use our API to build their own applications.
tMonitor’s IAQ
Sensors Identify

Temperature
°C
Humidity
%
Fine Dust
(PM01/2.5/10)µg/m3

TVOCs
ppb
CO2
ppm
Light
lux
AQI
AQI
NH3
ppm
CO
µg/m3
O3
µg/m3
SO2
µg/m3
Temperature
°C
Humidity
%
Dust
µg/m3
TVOCs
ppb
CO2
ppm
Light
lux
AQI
AQI
NH3
ppm
CO
µg/m3
O3
µg/m3
SO2
µg/m3
Temperature
°C
Humidity
%
Dust
µg/m3
TVOCs
ppb
CO2
ppm
Light
lux
AQI
AQI
NH3
ppm
CO
µg/m3
O3
µg/m3
SO2
µg/m3Sensors
Temperature
Temperature makes all the difference for productivity, comfort and mood.
Humidity
Too much or too little moisture leads to cold, flu symptoms and risk for toxic mold.
CO2
Indoor exposure to carbon dioxide can impair focus, decision-making and productivity.
Chemicals (TVOCs)
Toxic chemicals can be found in everyday materials. They can cause skin and respiratory irritation.
Fine Dust (PM01/2.5/10)
Dust can travel into our lungs and trigger health problems like asthma and allergies.
Light (Lux)
Light intensity can cause eye strain and migraines, hindering productivity and focus.
Air Quality Index
The AQI is an index for reporting daily air quality. It tells you how clean or polluted your air is, and what associated health effects might be a concern for you.
NH3
Exposure to concentrated levels of NH3 can cause headaches, nausea and burning sensation in eyes, nose, throat and skin.
CO
CO is odorless, colorless, and highly toxic. It kills by reducing the oxygen supply in the body and is a deadly poison.
O3
When inhaled, ozone can damage the lungs. Relatively low amounts can cause chest pain, coughing, shortness of breath and throat irritation.
SO2
SO2 irritates the nose, throat, and airways to cause coughing, wheezing, shortness of breath, or a tight feeling around the chest.
tMonitor Features
Tech Specs
Dimensions
Width: 6 Inch (153mm)
Height: 3.85 Inch (98mm)
Depth: 3.85 Inch (98mm)
Weight
220g (0.49 lbs)
System Requirements
Wi-Fi connection
Smartphone or tablet with support for Bluetooth 4.1, running iOS (8 or later) and Android (Jelly Bean
4.3 or later)
Connectivity Options
Wi-Fi (802.11 b/g/n @ 2.4GHz) w/ Bluetooth 4.1 for setup
Cellular (4G LTE) w/ Gateway and Bracket bundle
Ethernet w/ Gateway and Bracket bundle
Power Options
Wall Adapter (100~240V AC, 50/60Hz USB-C)
Power over Ethernet (PoE) w/ Bracket accessory
Direct AC/DC (7-36V) w/ Bracket accessory
Accessories
Stand
Wall mount unit with screws (recommended) and 3M tape
View All Specs

This dashboard is designed for you to monitor multiple tMonitor units in one simple, easy-to-use portal. You'll also have access to trends and advanced analytics.

Monitor multiple spaces at a glance with real-time data.

Analyze trends, compare spaces, and identify potential problems.

Set goals and customize notifications.